
Track project milestones, budgets, resource allocation, and team utilization at a glance.
What this dashboard shows
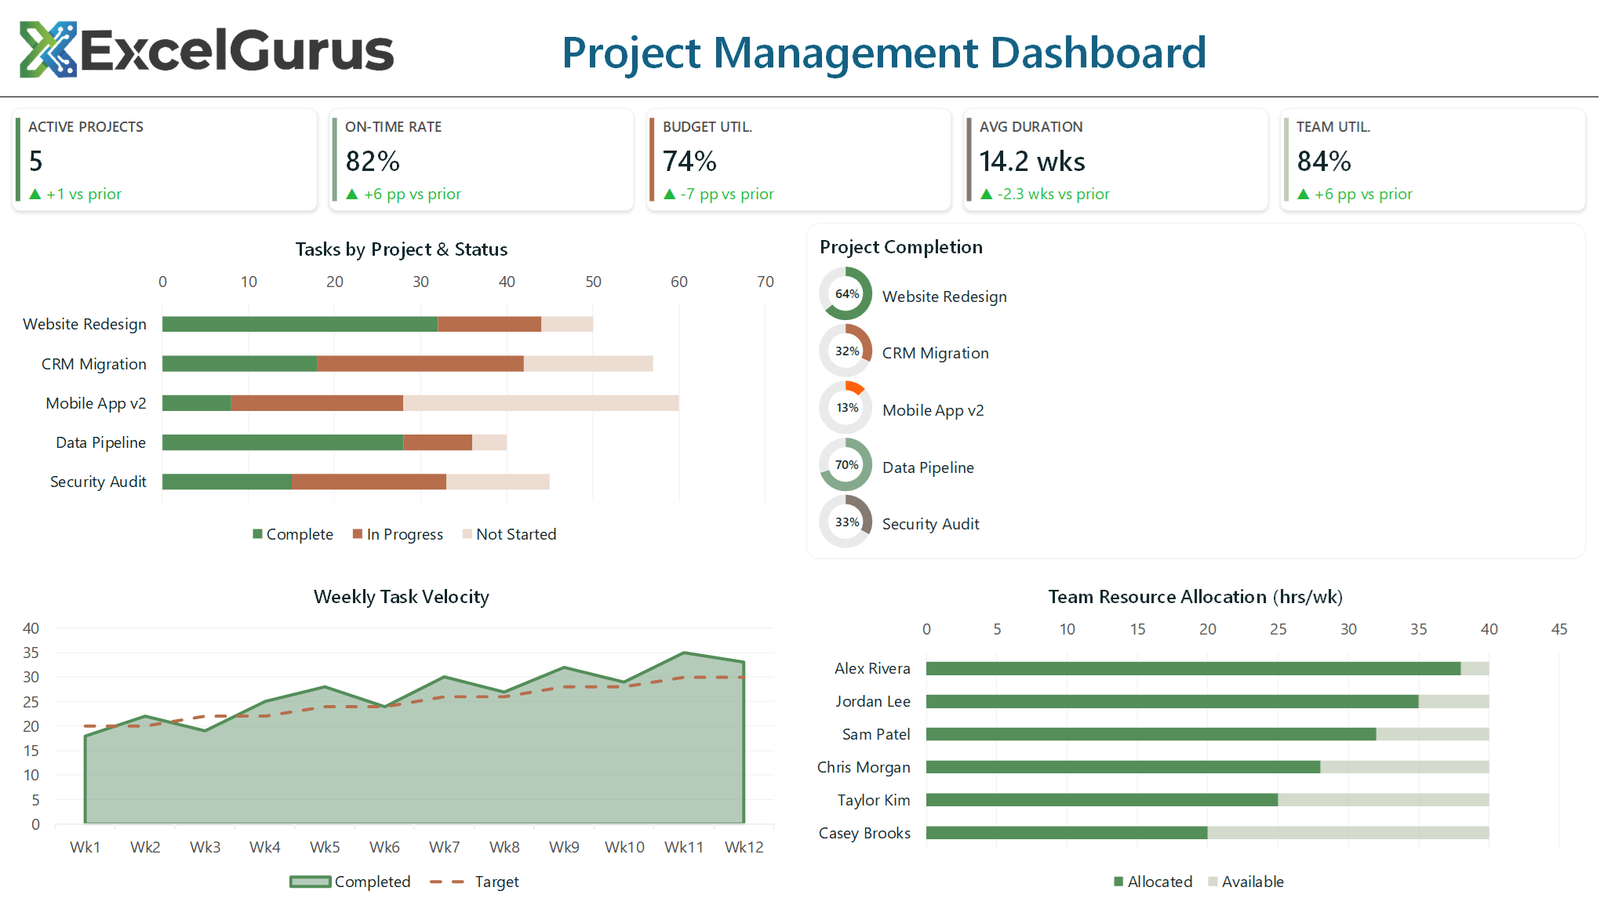
Five KPI cards cover active projects, on-time rate, budget utilization, average duration and team utilization. Below them, tasks are broken down by project and status, each project gets its own completion ring, weekly task velocity is tracked against target, and team members are shown by allocated hours against their capacity.
A ring per project, generated in a loop
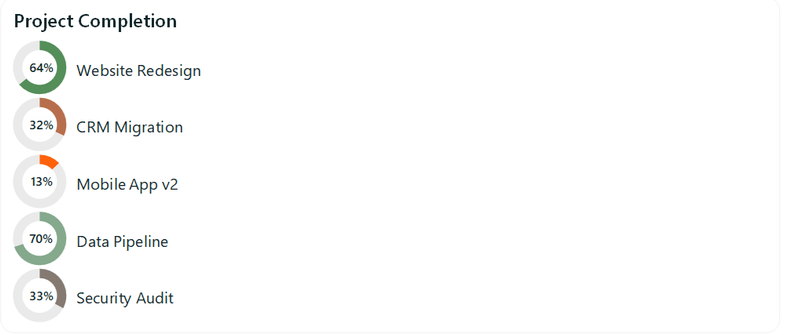
The completion panel is not one chart. It is five separate doughnut charts, each with two slices and a 65 percent hole, created inside a loop that steps the vertical position down by a fixed amount each time and pulls that project’s color from an array.
Writing it as a loop rather than five copies means adding a sixth project is a data change, not a layout job. That is the practical difference between a dashboard that is drawn once and one that is generated.
Stacked bars for status, and for capacity
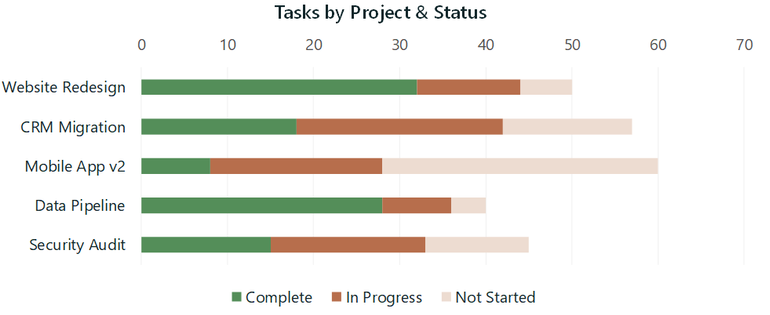
Tasks by project uses xlBarStacked with three series, so each bar’s total length is the size of the project and the segments show how much of it is done. Reading both scope and progress from one bar is something a grouped bar chart cannot do.
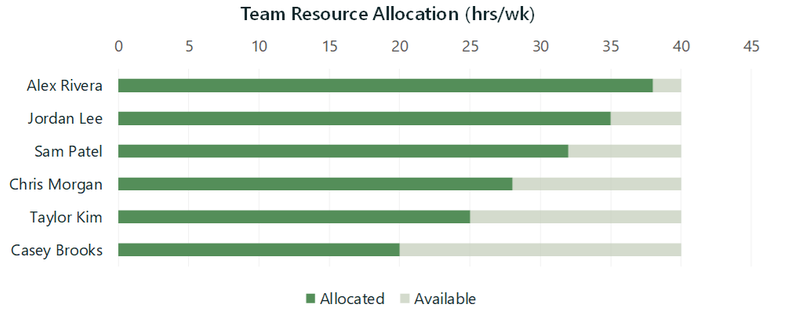
The resource chart uses the same stacking, but the second series is remaining availability rather than another category, filled in a pale gray. The result reads as a progress bar per person, showing at a glance who is at capacity and who has room.
How it is built
Everything on the sheet is drawn by VBA: shapes, text boxes and native Excel charts, positioned by absolute coordinate. There is no image, no add-in and no ActiveX control, so the file opens on any Windows Excel with nothing to install.
About this example
This is a demonstration build using sample data. It represents a typical system that our clients ask us to build for them, produced entirely in Excel and VBA so that every part of it can be rebuilt from scratch on demand.
Who it suits
Delivery leads and PMOs tracking several projects at once, where the underlying task data already exists in a tool or a sheet and the reporting is the part that eats the week.
Ready to Build Something Like This?
Managing multiple projects in Excel? We can build a dashboard that keeps everything visible in one view. → Get Excel Help