Track revenue, pipeline, and rep performance with automated KPI cards and interactive charts.
The Challenge
Managing sales performance across multiple reps, regions, and product lines often means juggling several spreadsheets and manually updating reports every week. This custom Excel VBA sales dashboard eliminates that work entirely.
What This Dashboard Does
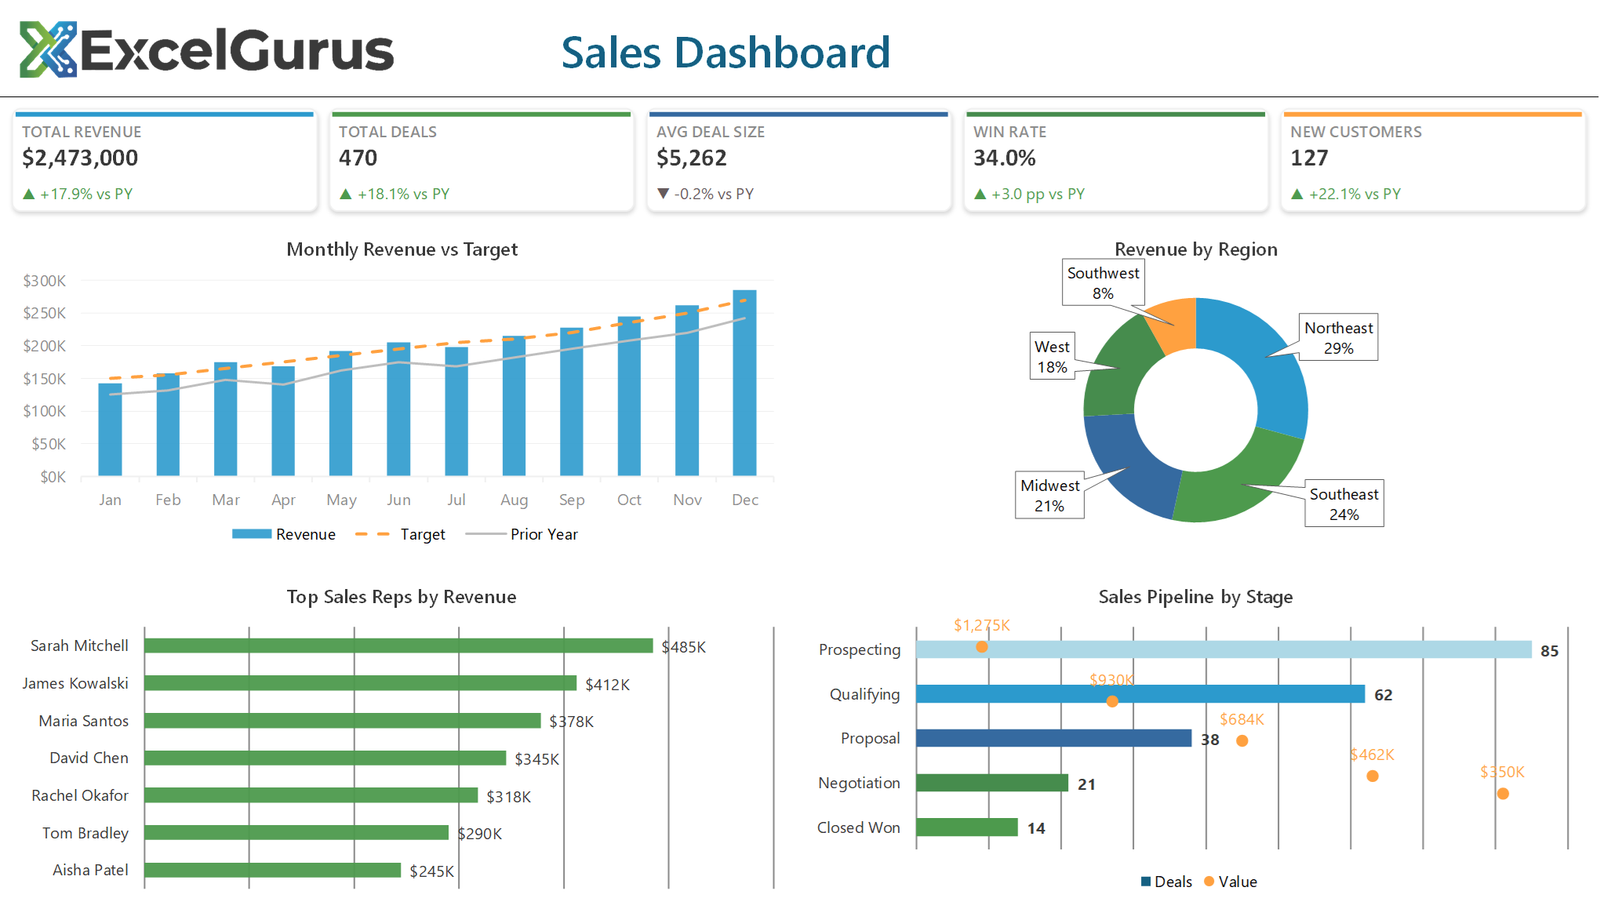
The dashboard features five dynamic KPI summary cards at the top — total revenue, number of deals closed, win rate, average deal size, and customer growth — each displaying year-over-year change indicators so leadership can spot trends at a glance. Below the KPIs, a monthly revenue vs. target combo chart compares actual performance against goals, making it immediately clear whether the team is on track.
A regional revenue donut chart breaks down performance by territory, while a horizontal bar chart ranks individual sales reps by their contribution. The color-coded pipeline tracker at the bottom shows deal stages from prospecting through closed-won, giving managers visibility into upcoming revenue.
Who It’s For
This type of dashboard is ideal for sales managers, directors of business development, and small business owners who want professional reporting without the cost of a BI platform like Tableau or Power BI. It runs entirely in Excel with no external dependencies, making it easy to deploy and share across any organization.
Technologies Used
Excel VBA · Chart Automation · Conditional Formatting · Dynamic Named Ranges · KPI Design
Ready to Build Something Like This?
Every business tracks sales differently. Tell us about your data and reporting needs, and we’ll design a dashboard that fits your workflow. → Start a Project