Track project milestones, budgets, resource allocation, and team utilization at a glance.
The Challenge
Project managers juggle timelines, budgets, resources, and stakeholder expectations — often across multiple projects simultaneously. This project management dashboard puts all of that information in one place, updated automatically from your project data.
What This Dashboard Does
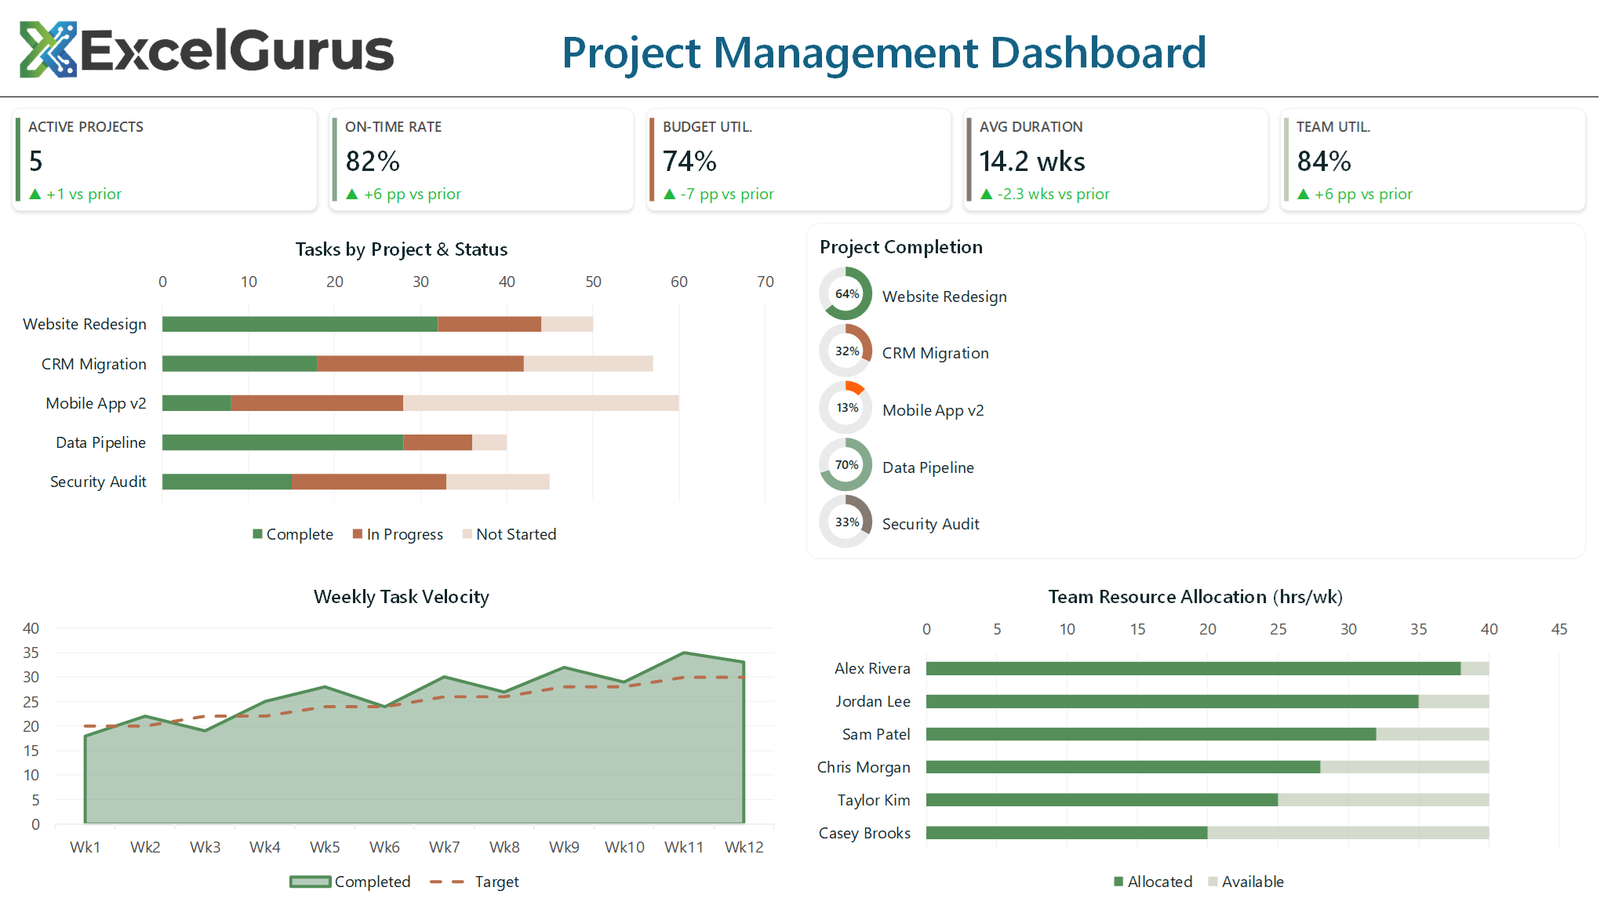
Five KPI cards across the top summarize portfolio health: active projects, on-time delivery rate, budget utilization, average project duration, and team utilization. These metrics give project directors an instant pulse check without opening individual project files.
Stacked bar charts show project progress by phase (planning, development, testing, deployment) across all active projects, making it easy to see which projects are moving and which are stuck. Mini progress doughnut charts provide per-project completion percentages in a compact format.
A resource allocation section shows team members and their current assignments, highlighting over-allocated and under-allocated staff. A milestone timeline tracks upcoming deadlines so nothing slips through the cracks.
How It Works
The sage and rose gold color scheme gives the dashboard a distinctive, professional look that stands out in project review meetings. Every chart and indicator is built with VBA and refreshes automatically when the underlying project data changes — no manual formatting required.
Who It’s For
This dashboard suits PMOs, project managers, and operations leaders who manage multiple concurrent projects and need a portfolio-level view without investing in tools like Monday.com or Microsoft Project.
Technologies Used
Excel VBA · Stacked Bar Charts · Progress Doughnuts · Resource Tracking · Milestone Visualization
Ready to Build Something Like This?
Managing multiple projects in Excel? We can build a dashboard that keeps everything visible in one view. → Start a Project